Rにおける外れ値解析 – 外れ値の検出と除去
皆さん、こんにちは!この記事では、Rプログラミングにおける外れ値分析について詳しく取り上げます。
では、始めましょう!! (Dewa, hajimemashou!!)
データの外れ値とは何ですか?(Data no hazurechi to wa nan desu ka?)
外れ値の概念に深入りする前に、データ値の前処理に焦点を当てましょう。
データサイエンスと機械学習の領域において、データ値の前処理は重要なステップとなります。前処理とは、モデリングを行う前に、データからエラーやノイズを取り除くことを指します。
前回の投稿では、Rプログラミングにおける欠損値の分析について理解しました。
今日は、同じくRにおける進んだレベルに焦点を当てて、外れ値の検出と除去について話しましょう。
「アウトライヤー」という名前通り、データセットの他の点から離れて存在するデータポイントを指します。つまり、他のデータ値から離れて出現するデータ値であり、データセット全体の分布を崩すものです。
通常、これはデータ値の異常な分布とみなされます。
モデルへの外れ値の影響
-
- データは歪んだ形式であることが分かります。
-
- 平均値、分散など、データの全体的な統計的分布を変えます。
- モデルの精度レベルにバイアスが生じることにつながります。
外れ値の効果を理解したら、実装に取り組む時が来ました。
外れ値解析 – はじめましょう!
最初に、データセットの外れ値の存在を検出することが非常に重要です。
では、始めましょう。私たちは「バイクレンタルの利用数予測」データセットを利用しました。データセットはこちらからご覧いただけます!
1. データセットの読み込み
最初に、read.csv()関数を使ってデータセットをR環境に読み込みました。
外れ値検出の前に、NULL値や欠損値の存在を確認するために、欠損値分析を実施しました。そのために、sum(is.na(data)) 関数を使用しました。
#Removed all the existing objects
rm(list = ls())

#Setting the working directory
setwd("D:/Ediwsor_Project - Bike_Rental_Count/")
getwd()

#Load the dataset
bike_data = read.csv("day.csv",header=TRUE)

### Missing Value Analysis ###
sum(is.na(bike_data))
summary(is.na(bike_data))

#From the above result, it is clear that the dataset contains NO Missing Values.
ここにあるデータには、欠損値はありません。
2. ボックスプロット機能を使用して外れ値を検出する。
これを言った以上、今はデータセットの外れ値の存在を検出する時です。これを達成するために、数値データの列を別のデータ構造/ 変数に c() 関数を使って保存しています。
さらに、数値変数の外れ値の存在を検出するために、boxplot()関数を使用しました。
ボックスプロット:
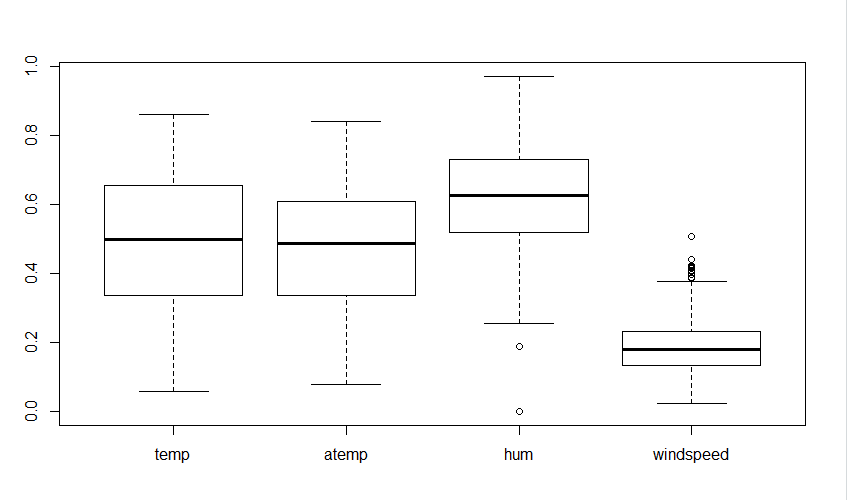
視覚的には、変数「hum」と「windspeed」にはデータの値に外れ値が含まれていることが明らかです。
3. 外れ値をNULL値で置き換える
今、Rで外れ値の分析を実行した後、boxplot()メソッドで特定された外れ値をNULL値で置き換えて、以下のように操作します。
##############################Outlier Analysis -- DETECTION###########################

# 1. Outliers in the data values exists only in continuous/numeric form of data variables. Thus, we need to store all the numeric and categorical independent variables into a separate array structure.
col = c('temp','cnt','hum','windspeed')
categorical_col = c("season","yr","mnth","holiday","weekday","workingday","weathersit")

# 2. Using BoxPlot to detect the presence of outliers in the numeric/continuous data columns.
boxplot(bike_data[,c('temp','atemp','hum','windspeed')])

# From the above visualization, it is clear that the data variables 'hum' and 'windspeed' contains outliers in the data values.
#OUTLIER ANALYSIS -- Removal of Outliers
# 1. From the boxplot, we have identified the presence of outliers. That is, the data values that are present above the upper quartile and below the lower quartile can be considered as the outlier data values.
# 2. Now, we will replace the outlier data values with NULL.

for (x in c('hum','windspeed'))
{
  value = bike_data[,x][bike_data[,x] %in% boxplot.stats(bike_data[,x])$out]
  bike_data[,x][bike_data[,x] %in% value] = NA
}

#Checking whether the outliers in the above defined columns are replaced by NULL or not
sum(is.na(bike_data$hum))
sum(is.na(bike_data$windspeed))
as.data.frame(colSums(is.na(bike_data)))
4. すべての外れ値がNULLで置き換えられていることを確認する。
今、私たちは欠損データの存在を確認します。つまり、外れ値が適切に欠損値に変換されているかをsum(is.na())関数を使用して確認します。
出力:
> sum(is.na(bike_data$hum))
[1] 2
> sum(is.na(bike_data$windspeed))
[1] 13
> as.data.frame(colSums(is.na(bike_data)))
           colSums(is.na(bike_data))
instant                            0
dteday                             0
season                             0
yr                                 0
mnth                               0
holiday                            0
weekday                            0
workingday                         0
weathersit                         0
temp                               0
atemp                              0
hum                                2
windspeed                         13
casual                             0
registered                         0
cnt                                0
その結果、私たちは「hum」列から外れ値の2つと「windspeed」列から外れ値の13つを欠損(NA)の値に変換しました。
5. ミスした値を持つ列を削除する
ついに、私たちは「tidyr」ライブラリからdrop_na()関数を使用して、NULLの値をドロップすることで、欠損値を処理します。
#Removing the null values
library(tidyr)
bike_data = drop_na(bike_data)
as.data.frame(colSums(is.na(bike_data)))
出力:
結果として、すべての外れ値は効果的に除かれました! (Kekka toshite, subete no hazurechi wa kōkateki ni nokare mashita!)
> as.data.frame(colSums(is.na(bike_data)))
           colSums(is.na(bike_data))
instant                            0
dteday                             0
season                             0
yr                                 0
mnth                               0
holiday                            0
weekday                            0
workingday                         0
weathersit                         0
temp                               0
atemp                              0
hum                                0
windspeed                          0
casual                             0
registered                         0
cnt                                0
結論
これにより、このトピックは終了しました。もし何か質問がある場合は、下のコメント欄に気軽にコメントしてください。Rプログラミングに関連するより多くの投稿をお楽しみに!
それまで、楽しい学習を続けてください!:)