Linuxのatopコマンドのガイド
atopコマンドはLinuxのシステムリソースを監視するためのツールです。このツールはプロセスレベルでシステムリソースの負荷量に関する多くの情報を表示します。この便利なユーティリティをマスターすることで、ユーザーには無限の利点があります。
まず最初に、atopコマンドをシステムにインストールする必要があります。Debian/Ubuntuユーザーは、以下の方法でインストールできます。
sudo apt install atop
他のLinuxユーザーは、標準のパッケージマネージャーを使用して、「atop」キーワードを続けることができます。
このコマンドは、システムに関連する複数の機密情報を表示する能力を持っています。データの抽象化を防ぐために、’sudo su’または’sudo -s’を使用して権限を昇格させることができます。sudoに関する完全なドキュメントがあります。
atopコマンドの基本的な出力
システムリソースのプロセスレベルの使用状況を表示するためには、単にターミナルで「atop」を実行すればよいです。
atop
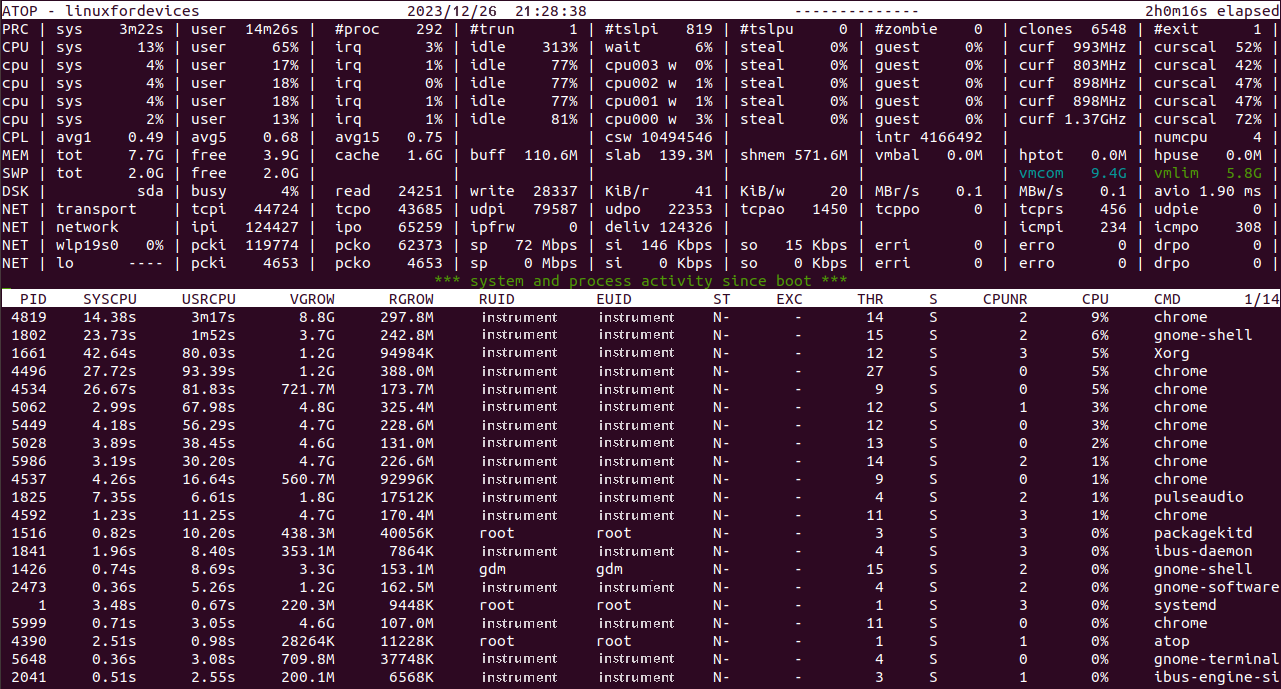
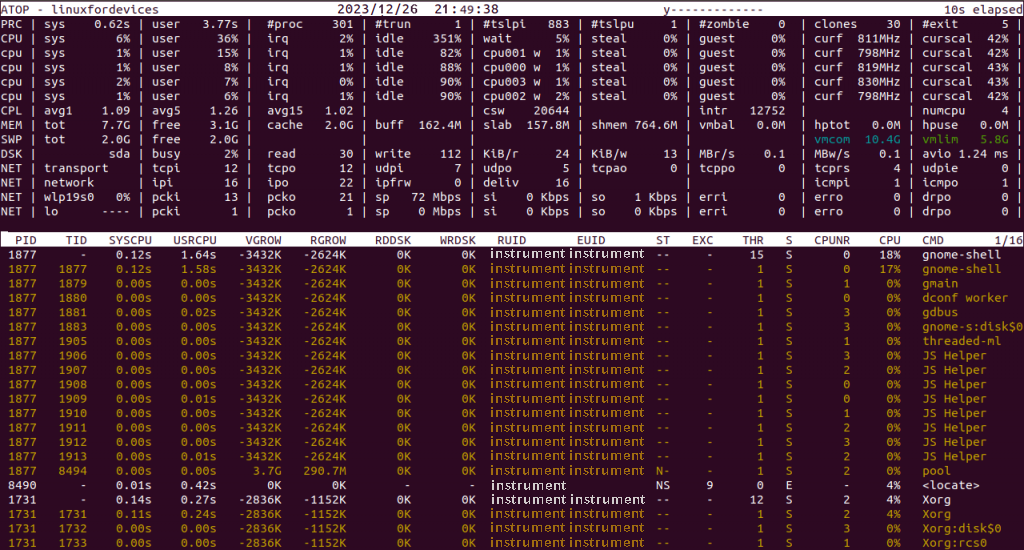
順を追ってご覧いただきましょう。画面全体が2つのパネルに分かれています。上のパネルでは、システムのリソースの累積使用状況が表示され、一方、下のパネルでは各プロセスの情報が詳細に表示されます。それぞれをご覧いただきましょう。
atopコマンドの累積統計
このビューの各エントリは、特定のシステムリソースに焦点を当てています。
1. プロセスに関連する統計情報
- PRC – stands for “process”.The first two values are the time consumed by the ‘sys’ (system) and ‘user’ processes.
It is followed by the total number of processes as ‘#proc’.
The next value is the number of threads currently running in the system. (‘#trun’)
‘#tslpi’ denotes the number of threads that are currently sleeping and interruptible.
‘#tslpu’ denotes the number of threads that are currently sleeping and uninterruptible.
The following value is the number of zombie processes.
Next up is the number of clone system calls.
The last value is the number of processes that ended during the elapsed time. (‘#exit’)
2. パフォーマンスに関連する統計情報
- CPU – relates to CPU utilization.The first two values show the percentage utilization of all the cores by the system and user processes.
The percentage of CPU used for interrupt requests. (‘irq’)
The next value is the idle percentage for all the cores combined.
The following value denotes the waiting each CPU core had to do.
Next up is the percentage for the steal time.
‘guest’ denotes the guest-percentage, which is the CPU time spent on other virtual machines.
The last two values indicate the current frequency of the CPU. - Now, the ‘atop’ displays the above statistics for each core independently.
- CPL – refers to as CPU Load.The first three values are the average loads with different periods: 1, 5, and 15 minutes.
This is followed by the number of context switches (‘csw’)
Next up is the number of interrupts (‘intr’)
The last value is number of available CPUs.
3. メモリに関連する統計データ
- MEM – Memory UtilizationThe total physical memory supported.
The memory currently free.
The current cache memory.
‘buff’ as in “buffer” is the amount of memory consumed in filesystem meta-data.
The sum of memory for kernel’s memory allocation shown as ‘slab’.
The amount of shared memory.
- SWP – Swap Memory.
ディスクに関連する統計情報
- DSK – Disk usageThe first value denotes the percentage of time the system is busy handling requests.
The reading requests issued.
The writing requests issued.
The rate at which data (in KB) is read per reading request.
The rate at which data (in KB) is written per writing request.
The next two values are time rates for reading and writing on the disk in Megabytes.
The last value is the average number of milliseconds spent in handling requests.
4. ネットワークに関連する統計
- NET – Network Statistics at the Transport Layer’transport’ signifies the Transport layer in Networking, which deals with the data protocols.
The number of segments received by the system following the TCP protocol. (‘tcpi’)
The number of segments transmitted. (‘tcpo’)
The similar statistics for UCP protocol. (‘udpi’ for UDP in) and (‘udpo’ for UDP out).
‘tcpao’ is the number of active TCP open connections.
Opposite to previous ‘tcppo’ is the number of passive TCP connections, but still open.
The figure of TCP retransmissions as ‘tcprs’.
The figure of UDP input errors as ‘udpie’. - NET – Network Statistics at the Network Layer’network’ signifies the Network Layer, which deals with Internet Protocols, IPv4 and IPv6 combined.
The number of IP packets received by the network interfaces. (‘ipi’)
The number of IP packets transmitted out from the interfaces. (‘ipo’)
The quantity of IP packets forwarded to other interfaces. (‘ipfrw’)
The quantity of IP packets delivered. (‘deliv’)
The last two entries are the number of ICMP packets received and transmitted by the network interfaces. - The following lines refer to each active network interface.The first value is the name of the network interface, like ‘wlp19s0’.
The following two packets are the number of packets that were received and transmitted through the particular interface. (‘pcki’ and ‘pcko’)
The network speed in Megabits (Mbps) as ‘sp’.
The rate at which bits are received and transmitted per second. (‘si’ and ‘so’)
The number of errors in packets received and transmitted. (‘erri’ and ‘erro’).
The last two values are the dropped packets in both ways. (‘drpi’ and ‘drpo’)
「atop」コマンドのトップパネルの説明は以上です。
各プロセスのシステムリソース
『atop』コマンドの値は、一定の時間間隔で更新されることに注目する価値があります。
「atop」コマンドの一般的な出力は、各プロセスエントリについて以下の詳細を表示します。
- PID – The process ID.
- SYSCPU – The amount of CPU consumed by the process while system handling.
- USRCPU – The amount of CPU consumed by the process, during its running in user mode.
- VGROW – The amount of virtual memory that the process has occupied since the last value update.
- RGROW – The amount of resident (physical) memory grown since last value update.
- RDDSK – The size of data transferred during disk reads.
- WRDSK – The size of data transferred during disk writes.
- RUID – The real user ID under which the process is being executed.
- EUID – The effective user ID under which the process is being executed.
- ST – The current status of the process.
- EXC – The exit code after the process terminates
- THR – The number of threads within the process.
- S – The current status of the primary thread of the process.
- CPU – The percentage of CPU utilization of the entire process.
- CMD – The name of the process.
この一般的な出力では、プロセスはCPU利用率の割合を基準にソートされています。この特定の出力では、あらゆるタイプのシステムリソースに関するわずかな情報が得られます。
各種システムリソースのプロセスレベル情報を学習しましょう。
atopコマンドのメモリベースの出力
「atop」コマンドを使用することで、システムで実行中の各プロセスのメモリ消費量を調べることができます。以下のコマンドを実行することで確認できます。
atop -m
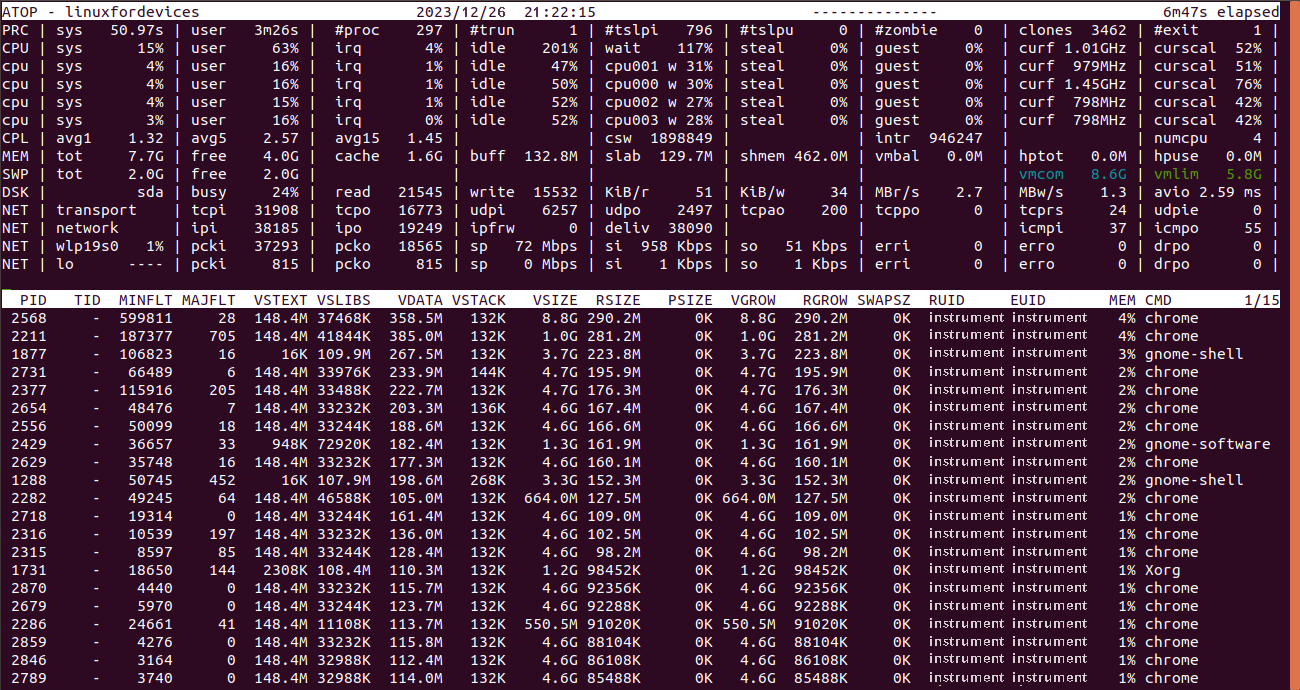
私たちが見るとおり、メモリオプション「-m」を追加しても、トップパネルは変わらずに残ります。ここで、各プロセスエントリの列について理解しましょう。
- PID – The process ID.
- TID – The thread ID.
- MINFLT – The number of minor page faults that have been solved by accessing data from free pages.
- MAJFLT – The number of major page faults that have been solved by especially retrieving data from disk.
- VSTEXT – The virtual memory occupied by the process text.
- VSLIBS – The virtual memory occupied by the shared libraries of the process.
- VDATA – The virtual memory size of the private data of the process.
- VSTACK – The virtual memory size of the private stack of the process.
- VSIZE – The total virtual memory size of the process.
- RSIZE – The total resident memory occupied by the process.
- MEM – The percentage of RAM consumed by the process.
プロセスは「MEM」の列に基づいて並べ替えられます。
「atop」は、ある種のインタラクティブなコマンドユーティリティですので、カラムをその内部から変更することができます。情報が表示されている間に、特定のオプションを入力するだけで、メモリ特化の出力に切り替えることができます。例えば、ターミナル上で「atop」を実行した後に、単に「m」と入力することでメモリの情報を表示することができます。
Linux内のatomコマンドを使用して、ディスクに特定の出力を行います。
ディスク利用状況に関連する情報を抽出するためには、 ‘atop’ コマンドと一緒に ‘-d’ オプションを使用することができます。
atop -d
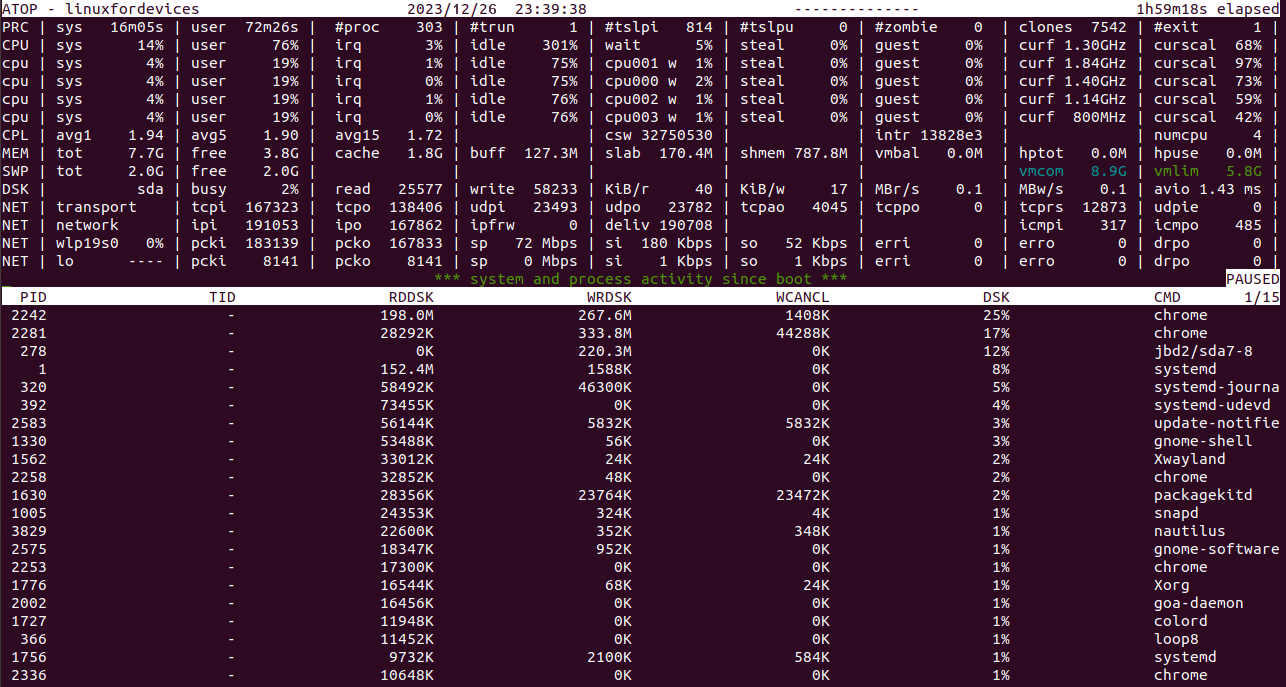
ディスク固有の出力には、気にする必要がある情報はあまりありません。主な結果のいくつかは次の通りです。
- RDDSK – The size of data transferred during disk reads.
- WRDSK – The size of data transferred during disk writes.
- WCANCL – The size of data initially written, but later withdrawn
- DSK – The percentage of Disk occupied.
- CMD – The name of the process.
注意すべきことは、プロセスが「DSK」の列に基づいて並べ替えられていることです。
atopコマンドを使用してバックグラウンドで実行中のコマンドを見つける
これは、コマンドラインの出力形式でバックグラウンドで実行されているプロセスとして実行中のコマンドを示しています。
atop -c
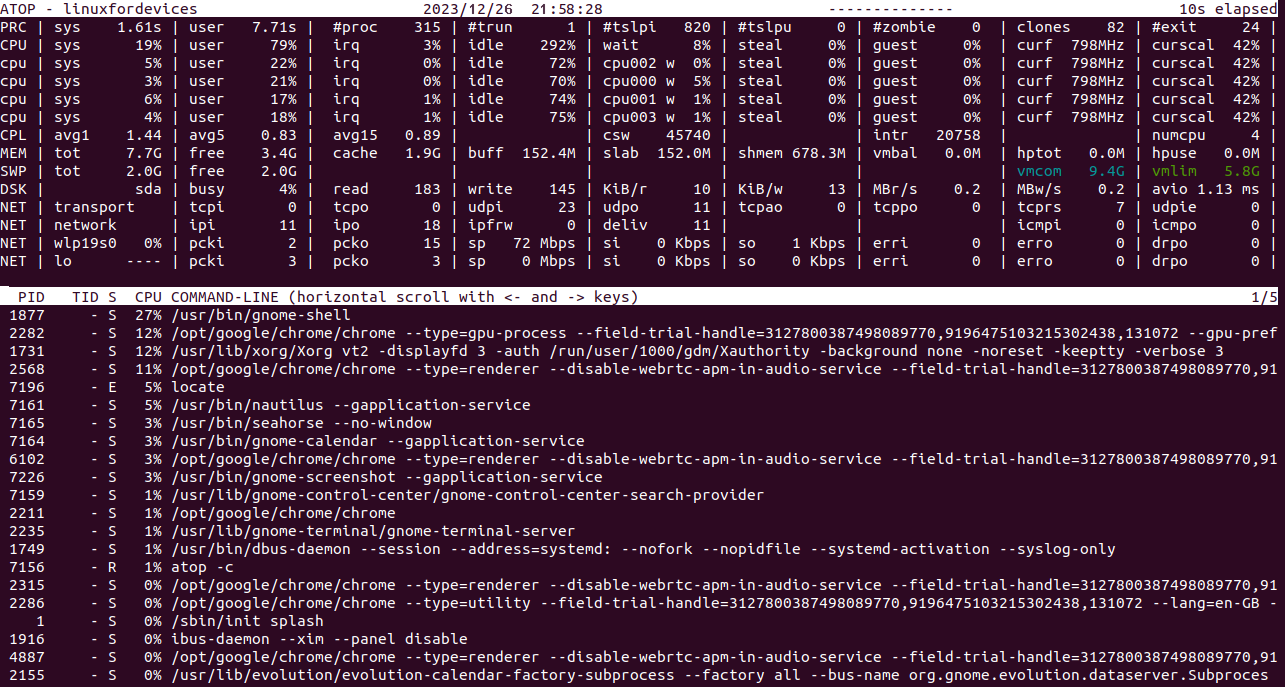
コマンドライン列の下にある行をコピーして貼り付けると、同じプロセスを再実行することができます。この出力には、プロセスを開始するためにバックグラウンドで実行されたコマンドが正確に示されます。
スレッドを基にした情報
プロセス情報を単に調査するだけでなく、atopコマンドはスレッド固有のリソース使用状況をチェックする機能を提供します。この出力にアクセスするためには、次のいずれかの方法を使用することができます。
atop -y
すでにシステムリソース情報が表示されている場合は、単純に「y」キーを押してください。
システムリソースの列はどれも変更されていないことは明らかです。追加されたのは各プロセスのスレッド数だけです。
雑多な情報
「atop」コマンドを使用して取得できる情報には、さまざまな種類があります。中でも便利なものはいくつかあります。
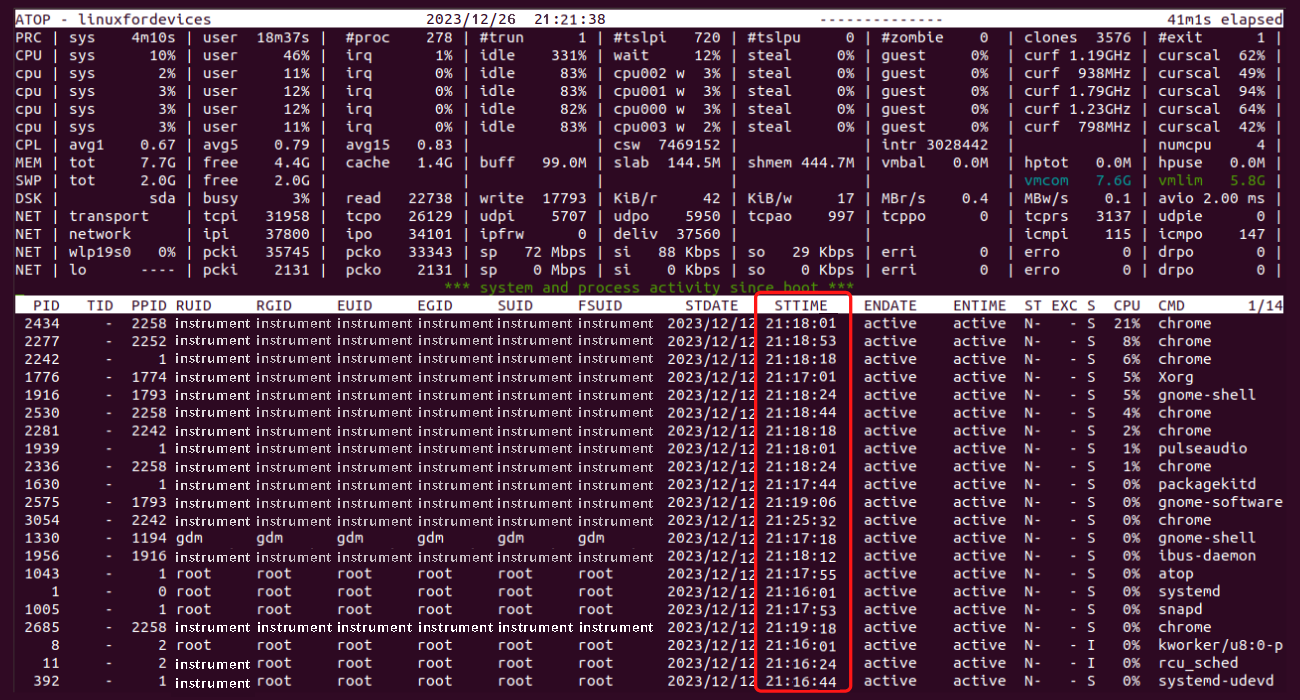
1. プロセスの開始時間を探す
‘-v’オプションを使えば、プロセスの特性を取得することができます。
atop -v
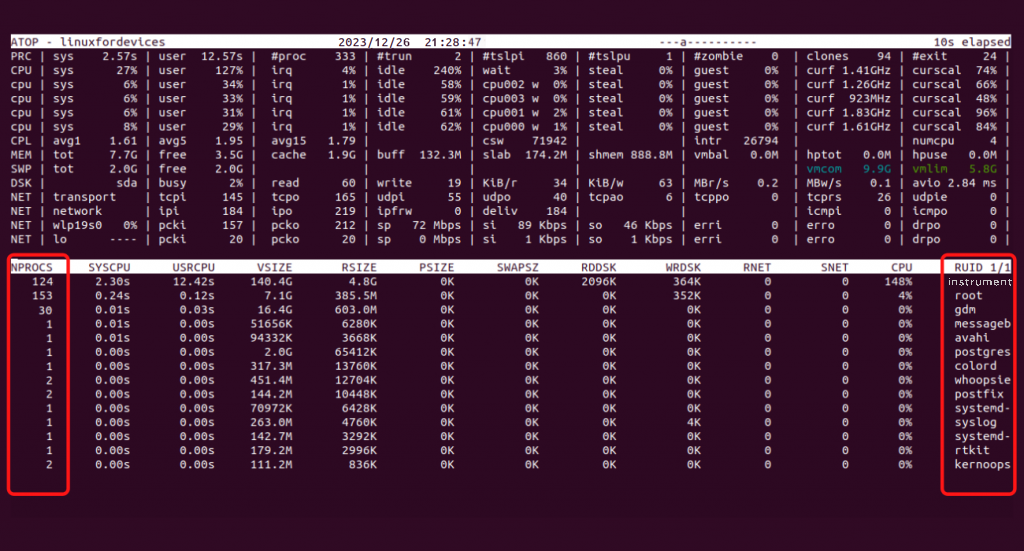
システム内の各ユーザーのプロセスの数
atop -au
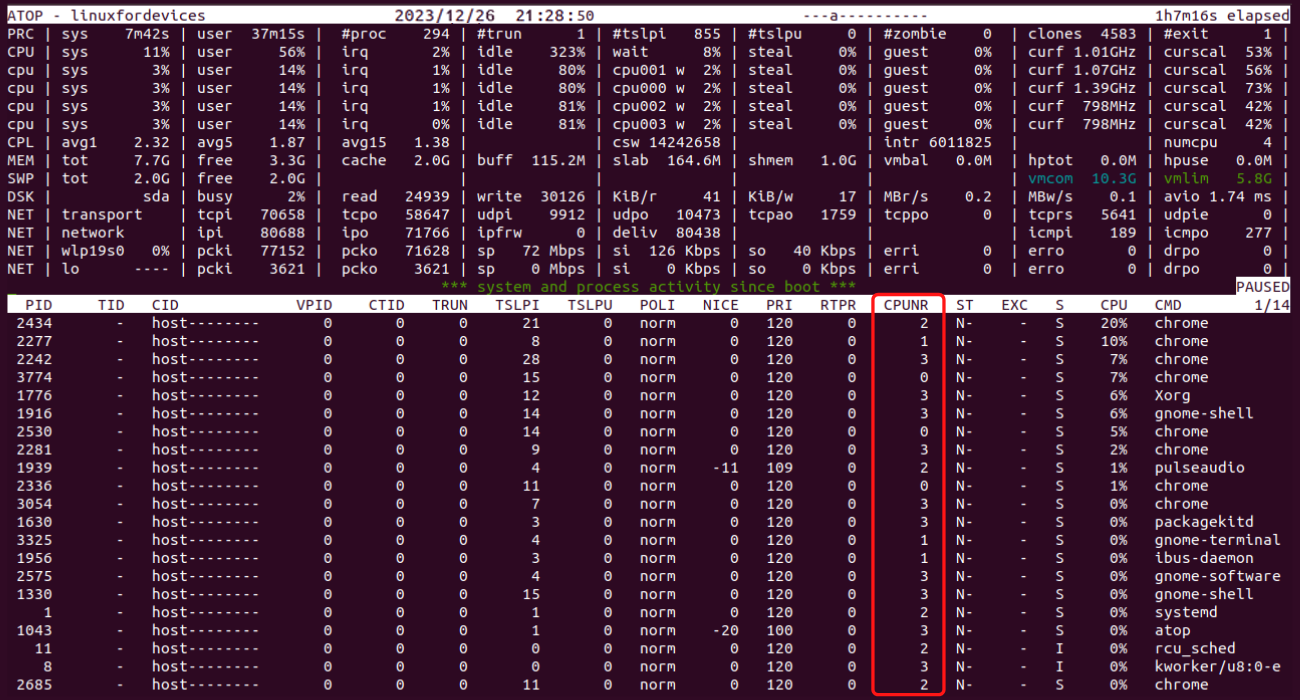
3. プロセスはどのコアで動いていますか? (Purosesu wa dono kō de ugoiteimasu ka?)
この種の情報は、プロセスのスケジューリング特性に該当します。’-s’オプションを使用してアクセスすることができます。
atop -s
いくつかの上級テクニック
有用な「atop」コマンドのトリックがいくつかあります。
- Pausing the ‘atop’ screen – using ‘z’ key.
- Changing the time interval of value updates – using ‘i’ key followed by the number of seconds, we wish to change it to.
- Interrupt to instantly update the values – using ‘t’ key.
- Quitting the display – using ‘q’ key.
結論
‘atop’コマンドは、どんなLinuxユーザーにとっても扱いにくいことがわかっています。この素晴らしいコマンドを学ぶには忍耐と粘り強さが必要です。何か質問があれば、コメント欄で気軽にご連絡ください。