How can you determine the standard deviation in R?
R, being a statistical language, provides the sd(’ ‘) function to calculate the standard deviation of the values.
What does the standard deviation mean?
‘Standard deviation is the measure of the dispersion of the values’.
The higher the standard deviation, the wider the spread of values.
- The lower the standard deviation, the narrower the spread of values.
- In simple words the formula is defined as – Standard deviation is the square root of the ‘variance’.
The significance of standard deviation.
Why is standard deviation so widely used and significant in statistics? The following factors explain its popularity and importance.
- Standard deviation converts the negative number to a positive number by squaring it.
- It shows the larger deviations so that you can particularly look over them.
- It shows the central tendency, which is a very useful function in the analysis.
- It has a major role to play in finance, business, analysis, and measurements.
Before we dive into the subject, make sure to remember this definition!
Variance can be described as the squared deviations between the observed value and the expected value.
Calculate the standard deviation of a list of values in R.
Firstly, we will generate a list called ‘x’ and append certain values to it. Subsequently, we can calculate the standard deviation of those values within the list.
 x <- c(34,56,87,65,34,56,89)    #creates list 'x' with some values in it.

 sd(x)  #calculates the standard deviation of the values in the list 'x'
The result is 22.28175.
We can now attempt to derive the standard deviation by extracting particular values from the list ‘y’.
 y <- c(34,65,78,96,56,78,54,57,89)  #creates a list 'y' having some values

data1 <- y[1:5] #extract specific values using its Index

sd(data1) #calculates the standard deviation for Indexed or extracted values from the list.
The result is 23.28519.
Calculate the standard deviation of the values contained in a CSV file.
We are utilizing this approach to bring in a CSV file, where we aim to calculate the standard deviation in R for the data stored within the file.
readfile <- read.csv('testdata1.csv')  #reading a csv file

data2 <- readfile$Values      #getting values stored in the header 'Values'

sd(data2)                              #calculates the standard deviation
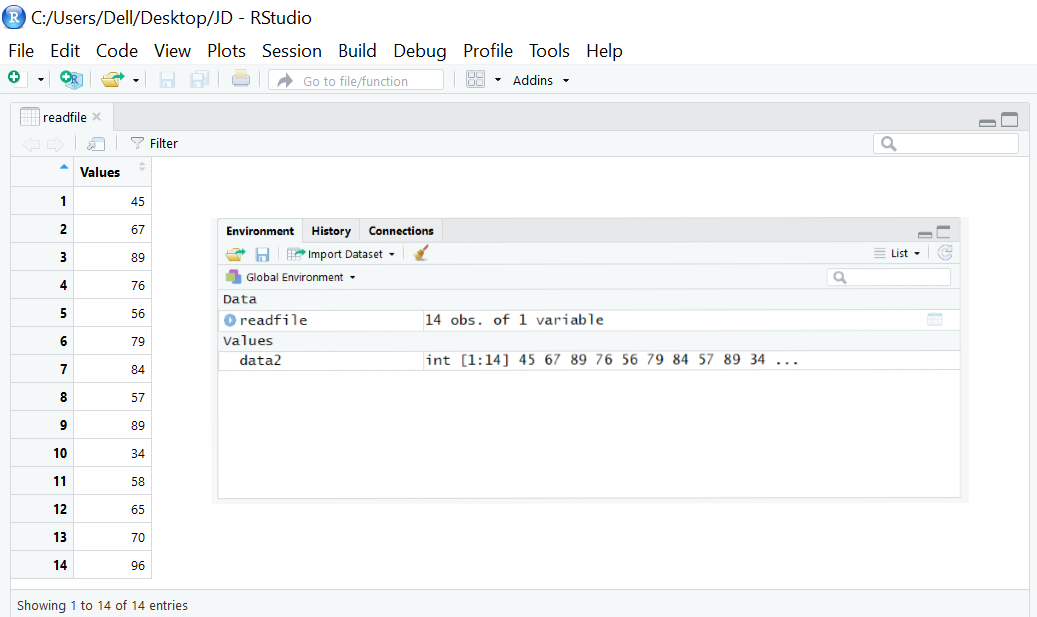
The result is 17.88624.
Large and small variability
Typically, low standard deviation results in values that are very similar to the average, whereas high standard deviation leads to values that are widely scattered from the average.
We can demonstrate this using an example.
x <- c(79,82,84,96,98)
mean(x)
--->  82.22222
sd(x)
--->  10.58038
To create a bar graph in R using these values, execute the code provided below.
In order to install the ggplot2 package, execute this code within the R studio environment.
Please install the package “ggplot2”.
library(ggplot2)

values <- data.frame(marks=c(79,82,84,96,98), students=c(0,1,2,3,4,))
head(values)                  #displayes the values
 marks students
1    79        0
2    82        1
3    84        2
4    96        3
5    98        4
x <- ggplot(values, aes(x=marks, y=students))+geom_bar(stat='identity')
x                             #displays the plot
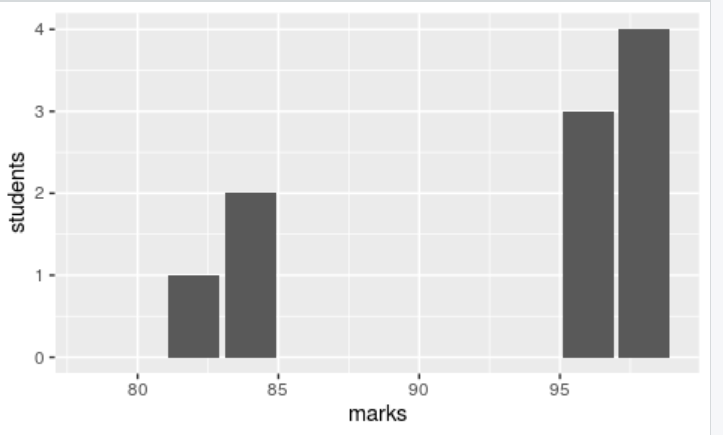
From the aforementioned findings, it is evident that a majority of the data is concentrated around the average value (79,82,84), indicating a narrow range or low standard deviation.
Example representing a significant deviation from the norm.
y <- c(23,27,30,35,55,76,79,82,84,94,96)
mean(y)
---> 61.90909
sd(y)
---> 28.45507
To generate a bar graph in R using ggplot and plot the given values, execute the code provided below.
library(ggplot2)

values <- data.frame(marks=c(23,27,30,35,55,76,79,82,84,94,96), students=c(0,1,2,3,4,5,6,7,8,9,10))
head(values)                  #displayes the values
  marks students
1    23        0
2    27        1
3    30        2
4    35        3
5    55        4
6    76        5
x <- ggplot(values, aes(x=marks, y=students))+geom_bar(stat='identity')
x                             #displays the plot
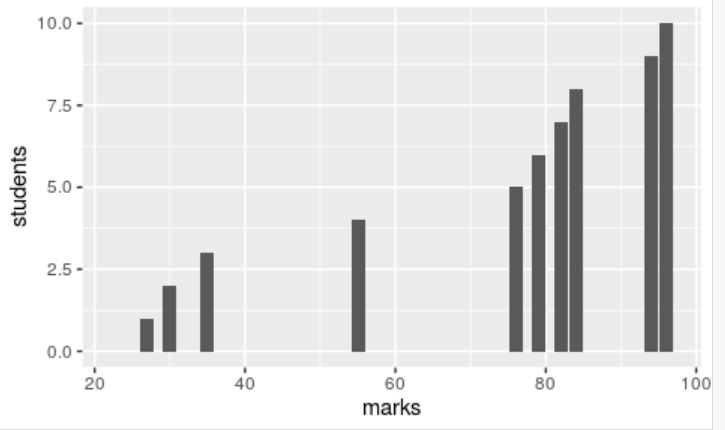
In the aforementioned findings, you can observe the extensive data. The minimum score of 23 stands significantly apart from the mean score of 61. This phenomenon is referred to as a high standard deviation.
At this point, you should have a decent grasp of how to calculate the standard deviation using the sd(’ ‘) function in the R programming language. To conclude this tutorial, let’s solve some straightforward problems.
Example #1: Calculating the Standard Deviation of a Sequence of Even Numbers
Calculate the standard deviation of the even numbers ranging from 2 to 18 (excluding 1 and 20).
The solution entails listing the even numbers ranging from 1 to 20.
Two, four, six, eight, ten, twelve, fourteen, sixteen, eighteen.
Let’s determine the standard deviation of these values.
x <- c(2,4,6,8,10,12,14,16,18)  #list of even numbers from 1 to 20

sd(x)                           #calculates the standard deviation of these
                            values in the list of even numbers from 1 to 20
The result is approximately 5.477226.
One possible option for paraphrasing the statement is:
The US Population Data’s Standard Deviation is given in Example #2.
Calculate the USA’s state-wise population’s standard deviation.
To accomplish this in R, import the CSV file and extract the data. Then, calculate the standard deviation of the values and visualize the outcome by plotting it on a histogram.
df<-read.csv("population.csv")      #reads csv file
data<-df$X2018.Population           #extarcts the data from population
                                     column
mean(data)                          #calculates the mean

View(df)                            #displays the data
sd(data)                            #calculates the standard deviation
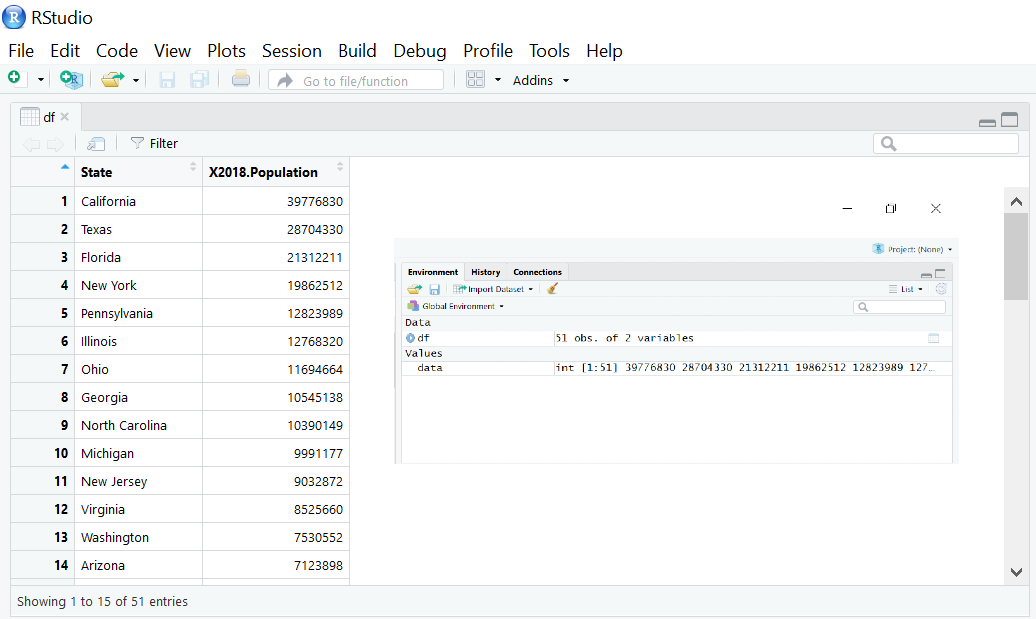
The output shows that the mean is 6432008 and the standard deviation is 7376752.
In summary,
Calculating the standard deviation of values in R is straightforward. R provides the sd(’ ‘) function to determine the standard deviation. You have the option to either generate a list of values or import a CSV file in order to compute the standard deviation.
Make sure to calculate the standard deviation by extracting values using indexing from a file or list as demonstrated above.
Feel free to use the comment box to share any questions or uncertainties you may have about the sd(’ ‘) function in R. Enjoy the learning experience!
more tutorials
get pandas DataFrame from an API endpoint that lacks order?(Opens in a new browser tab)
How to include items to a list in Python(Opens in a new browser tab)
Basics of Graph Plotting – Comprehending the plot() Function in R(Opens in a new browser tab)
A tutorial on the Python Pandas module.(Opens in a new browser tab)

